BrushFinder is decode, detector, map, library and export, in that order. This page walks each screen in the order you would actually use them.
Load and decode
Point it at the card.
Load an .RSD file straight off your Garmin card and BrushFinder decodes it into tiled imagery (how to get recordings off the card). All four channels decode: ClearVü high and very-high frequency, SideVü port and starboard.
Recording info, from the recording's menu, gives the date, duration, distance, depth range, water temperature and speed of what you just loaded.
Batch decode: scan the whole card and it decodes the lot, skipping any recording it has already done, so running it again costs nothing.
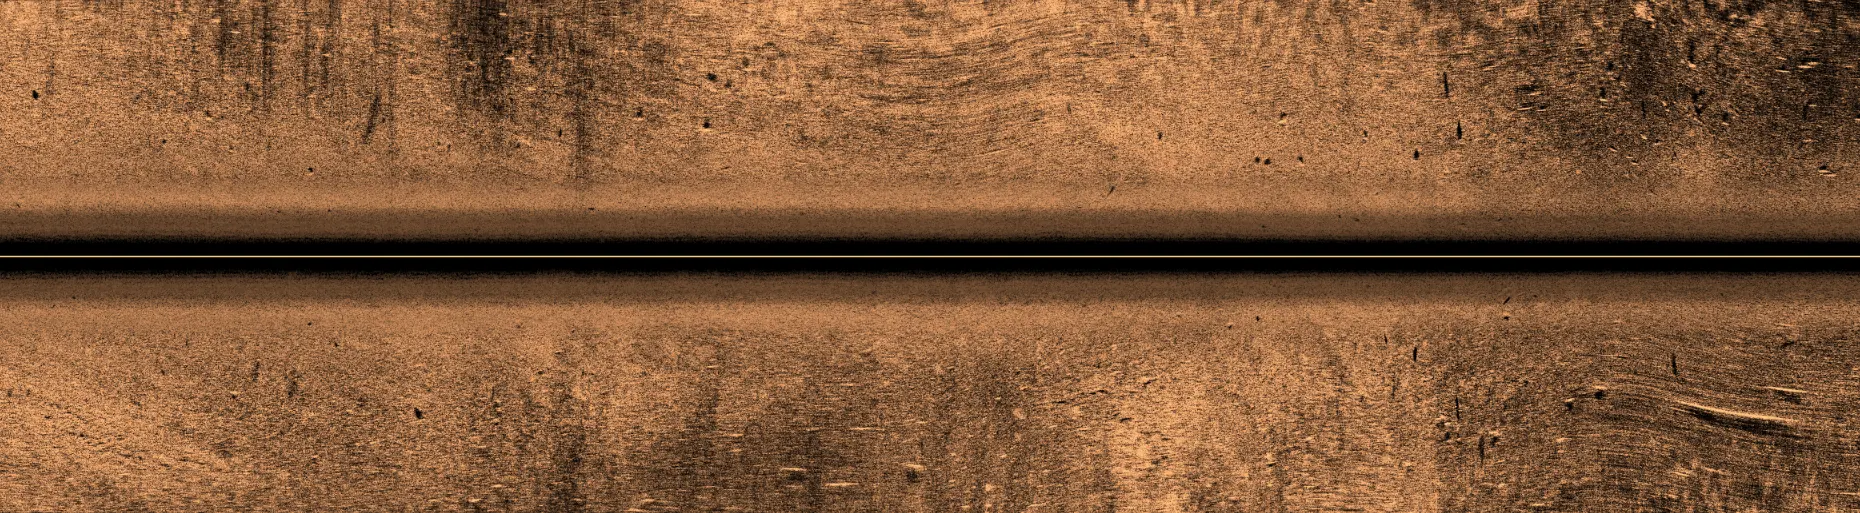
One pass of SideVü as BrushFinder renders it.
What it found
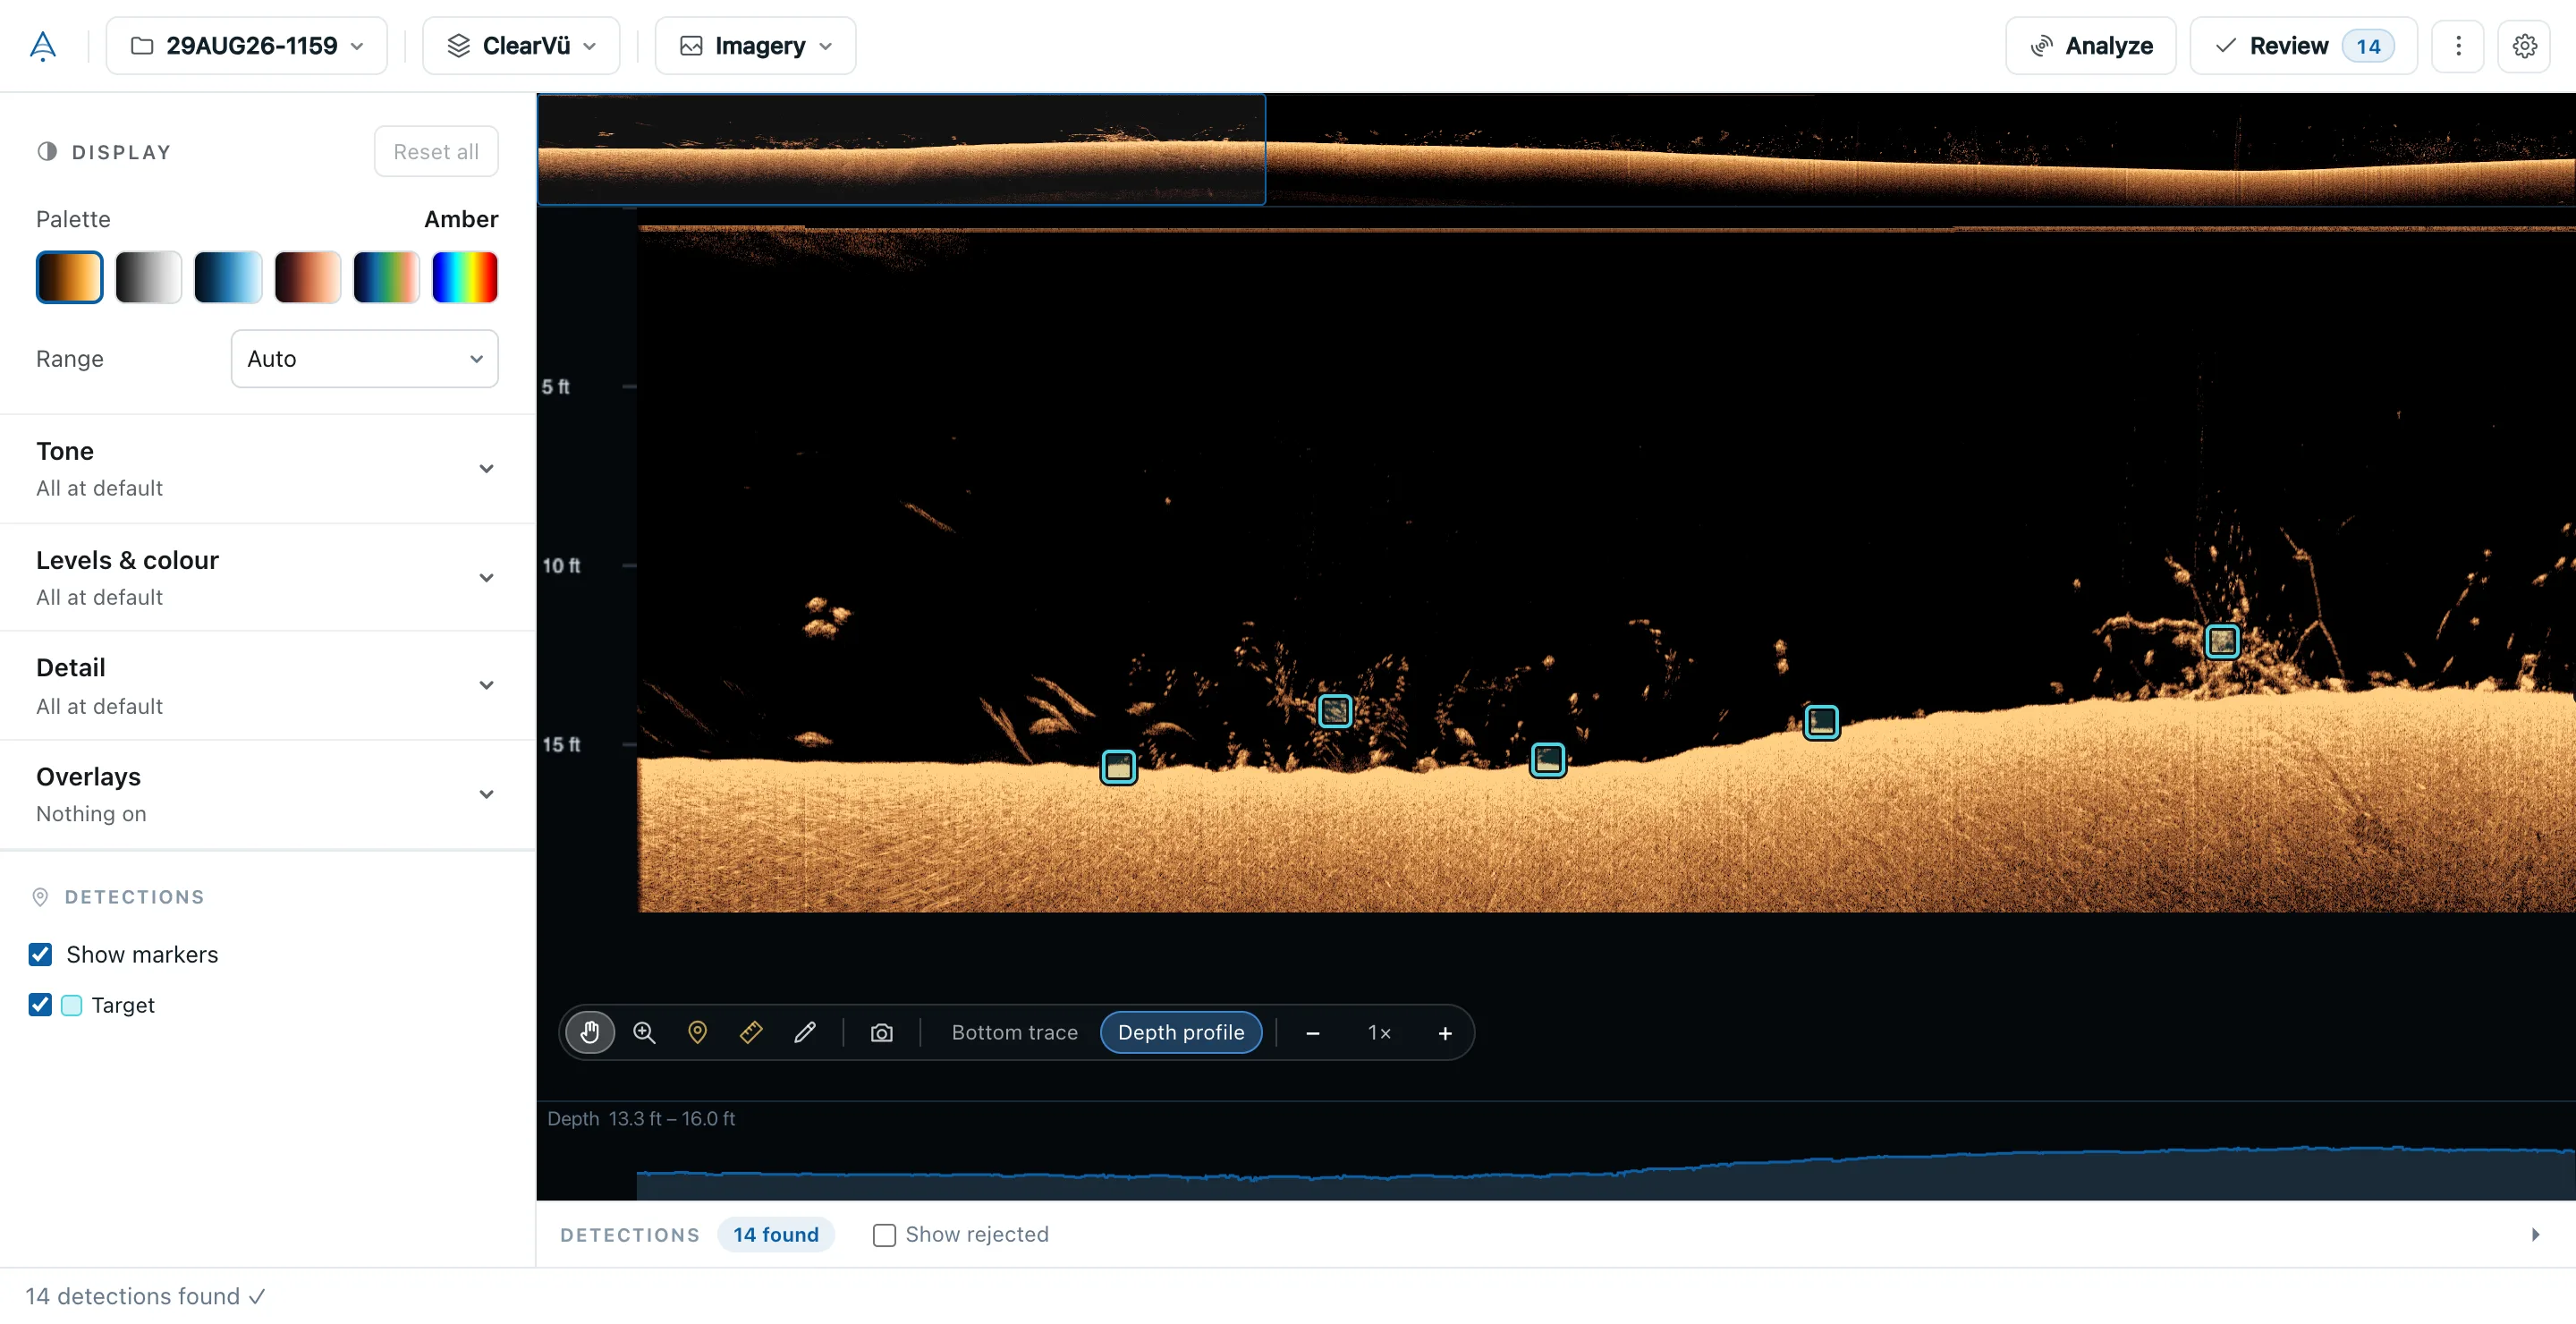
The detector's finds, next to the return that made them.
Every detection is marked on the imagery at the ping and depth it came from, so you can look at the sonar return yourself before you trust it. A mark exists because a patch of imagery earned it, and that patch is right there.
BrushFinder
A real recording from 29 August: brush off a 15-foot bottom, each box a detection.
Side scan
Sharper, and true to scale.
SideVü is drawn from the full detail your unit recorded, not a squashed copy of it, so a log reads as a log and not a smear. Distances across the swath are true: a laydown 15 feet out is drawn 15 feet out, with a scale along the top to read it off.
Side scan is shown upright, the way your chartplotter shows it, with the boat's track down the middle. Slant-range correction can be switched off to see the return exactly as it came back, and Smoothing, Sharpen, TVG and noise controls tune the picture for your water.
Bottom trace and depth profile
Where the bottom is, the whole way along.
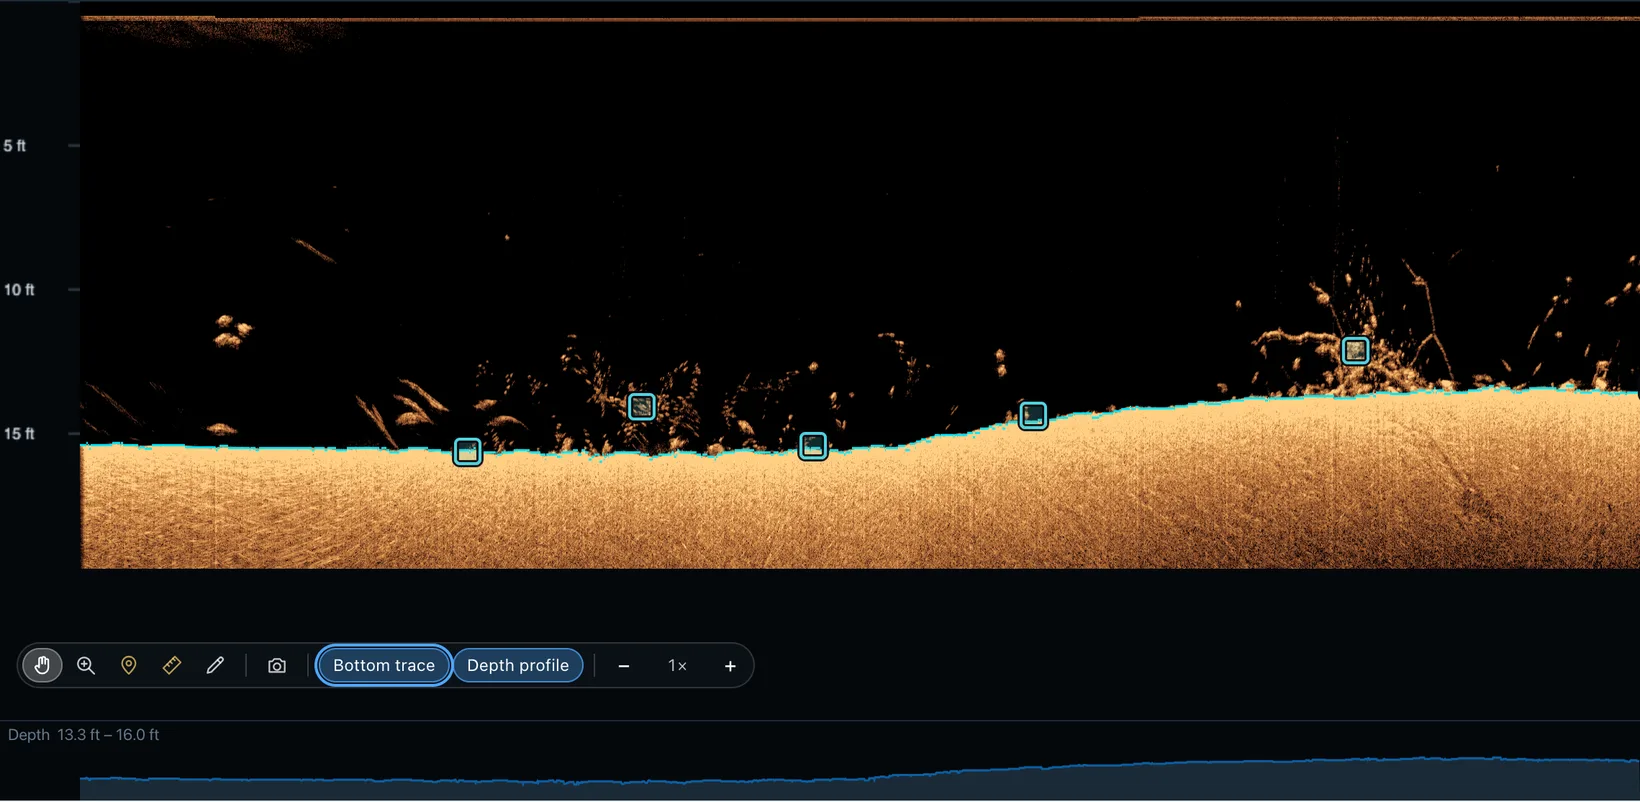
Turn on Bottom trace and a line follows the bottom through the down scan. Depth profile draws the depth of the whole pass underneath the imagery, with its shallowest and deepest reading. Both are on the tool bar, and the depth profile shows under Playback too.
Measure snaps to the bottom line, so the height of a pile is measured from the bottom it stands on rather than from wherever the click landed.
BrushFinder
Bottom trace on, with the depth profile of the pass underneath.
Ask AI
Ask about the recording in front of you.
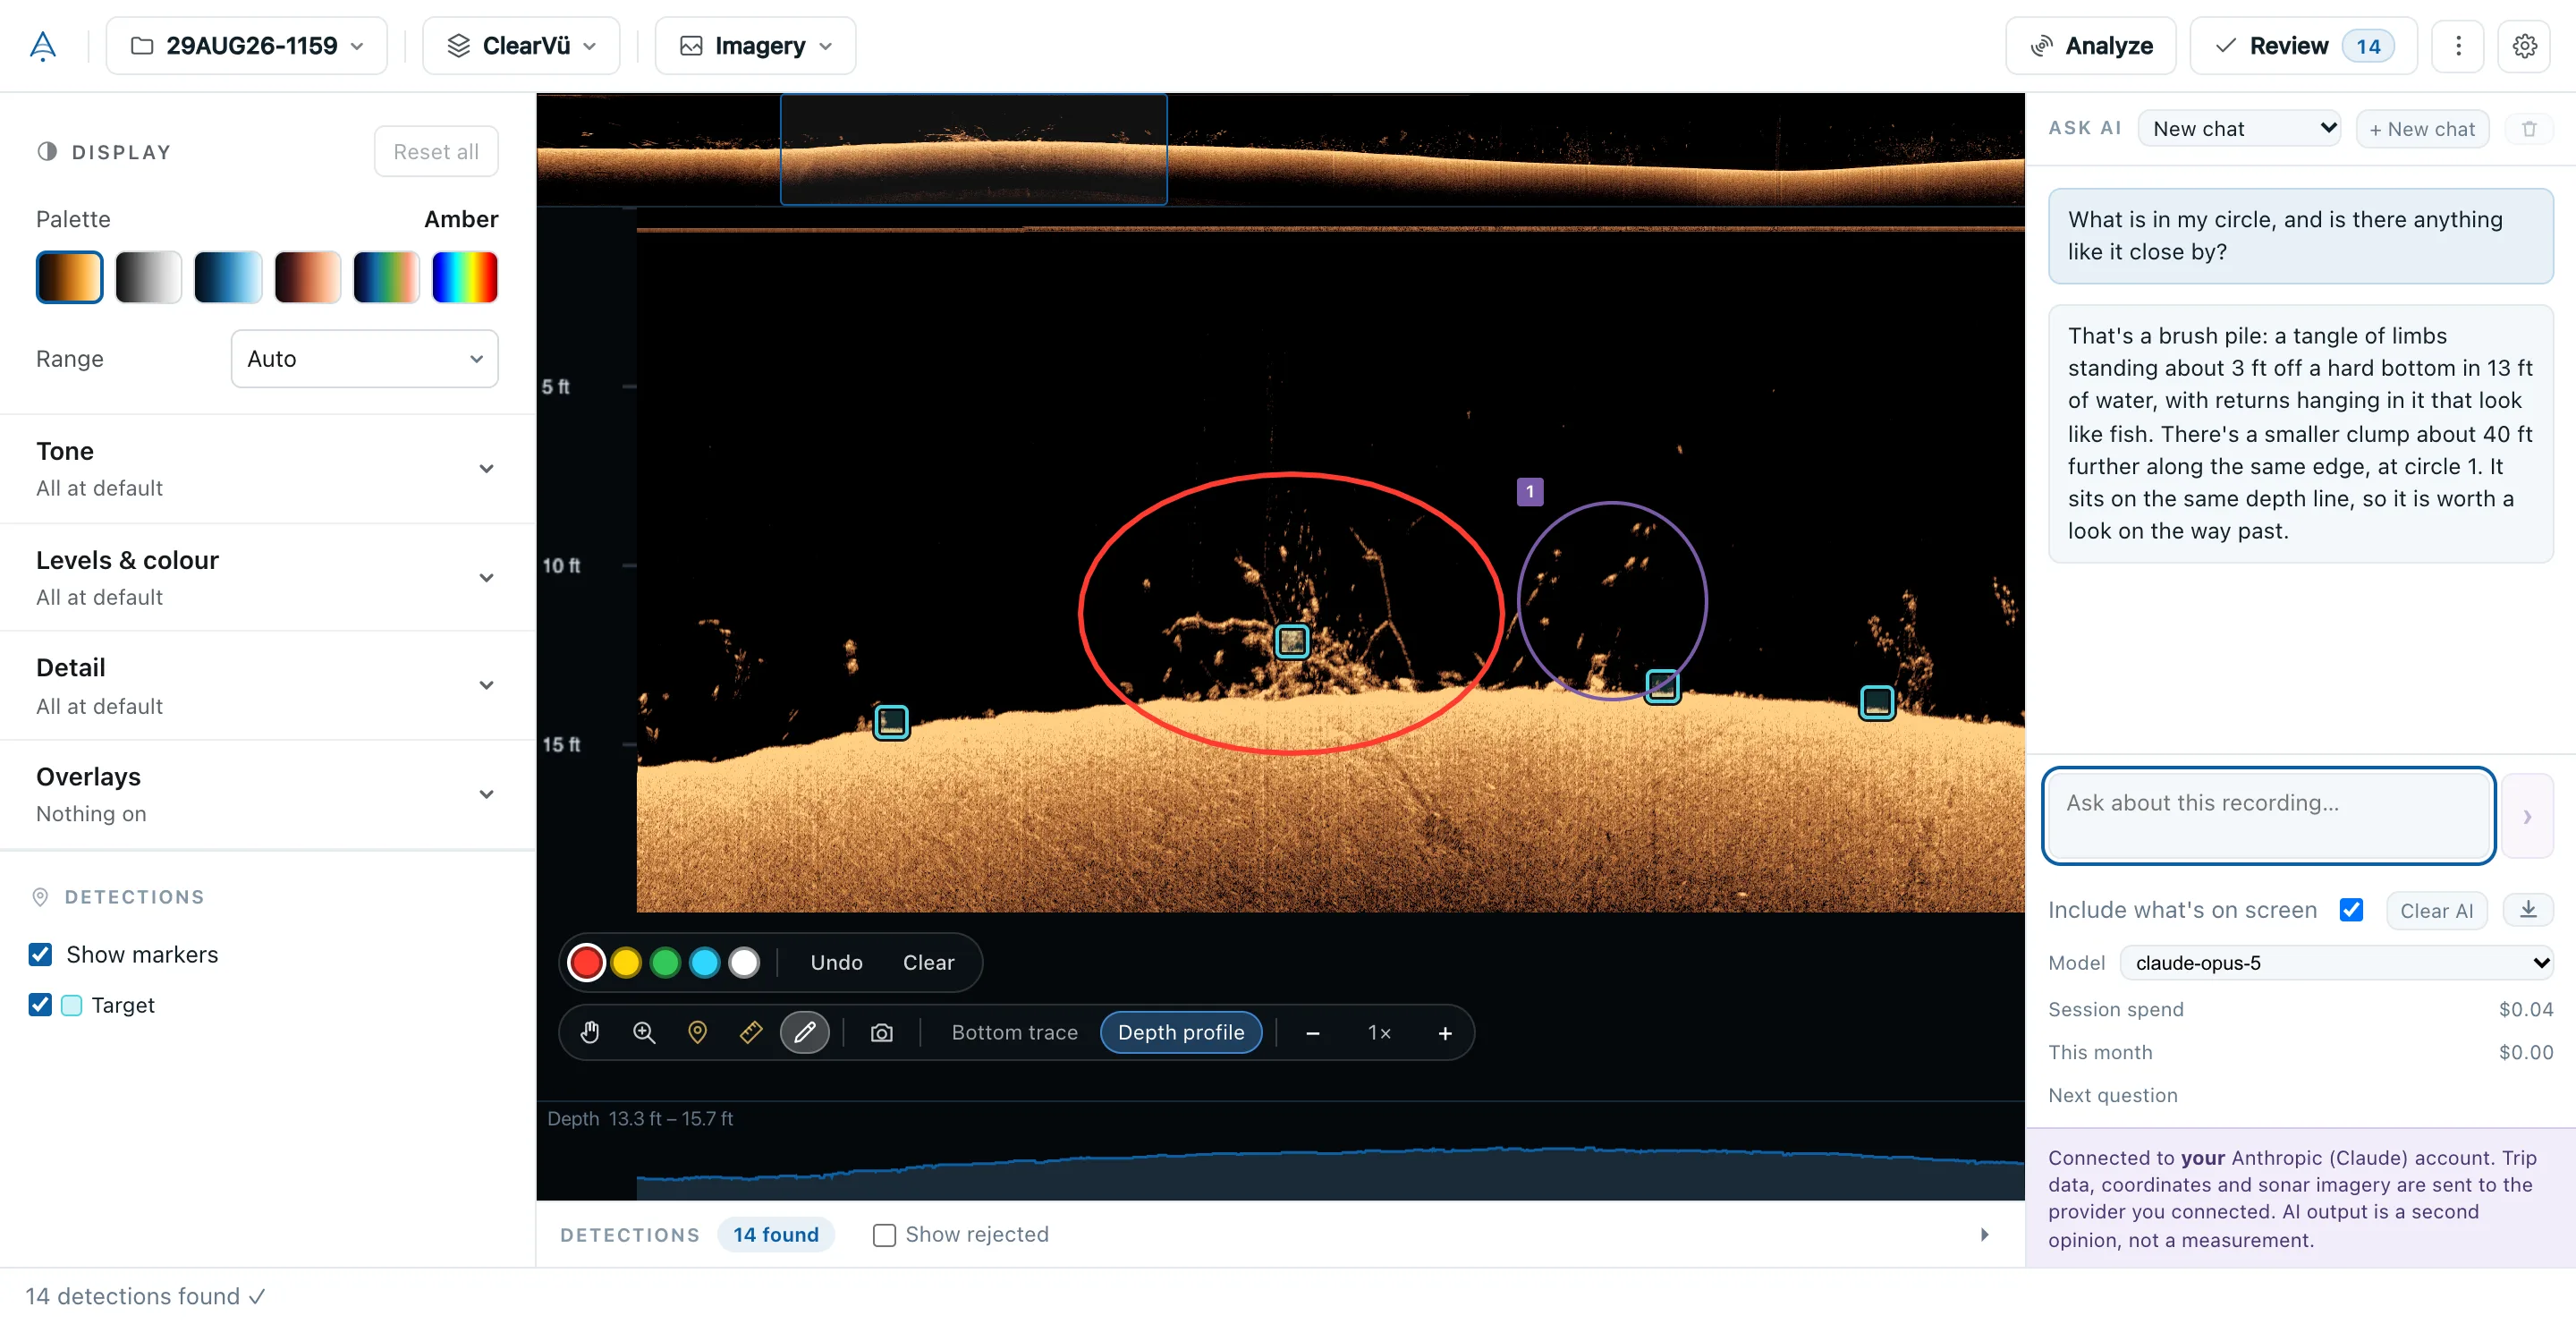
Ask questions about the recording you have open: what a return looks like, where the cover is thickest, how this trip compares with the last one. By default the model sees the sonar on screen with your question. You can turn that off next to where you type, which also makes a question cheaper.
Circle something with the drawing tool and the model sees exactly what you circled. Ask it to look for something and it suggests candidates; nothing joins your results until you add it, and nothing that costs money runs until you press the button.
Chats are kept with the recording they are about. Come back to a recording and its last chat is there, circles included; start a new chat whenever you like, or reopen an old one from the list. Stop works at any moment, and Export saves the conversation, or the whole session with its pictures, next to your saved views.
BrushFinder
Circle a pile and ask. The answer can circle things back.
Your AI account
Your key, your provider, your bill.
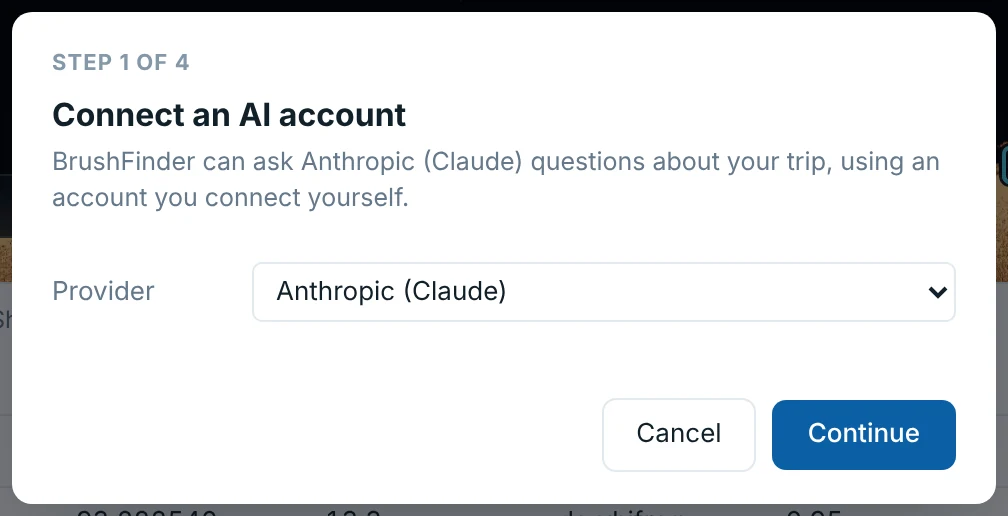
BrushFinder ships with no AI key and contacts no AI company until you connect an account of your own: Anthropic (Claude), Google (Gemini) or OpenRouter. You can switch provider in Settings, and disconnecting deletes the key from your computer.
Requests go from your computer straight to that company, never through us, and they bill you directly. If you connect a router such as OpenRouter, BrushFinder asks it by default to use only companies that don't keep your request or train on it.
Every position, depth and height is still measured by BrushFinder's own code. The model finds and labels; it never supplies a number.
Step 1 of connecting an account.
Map analysis
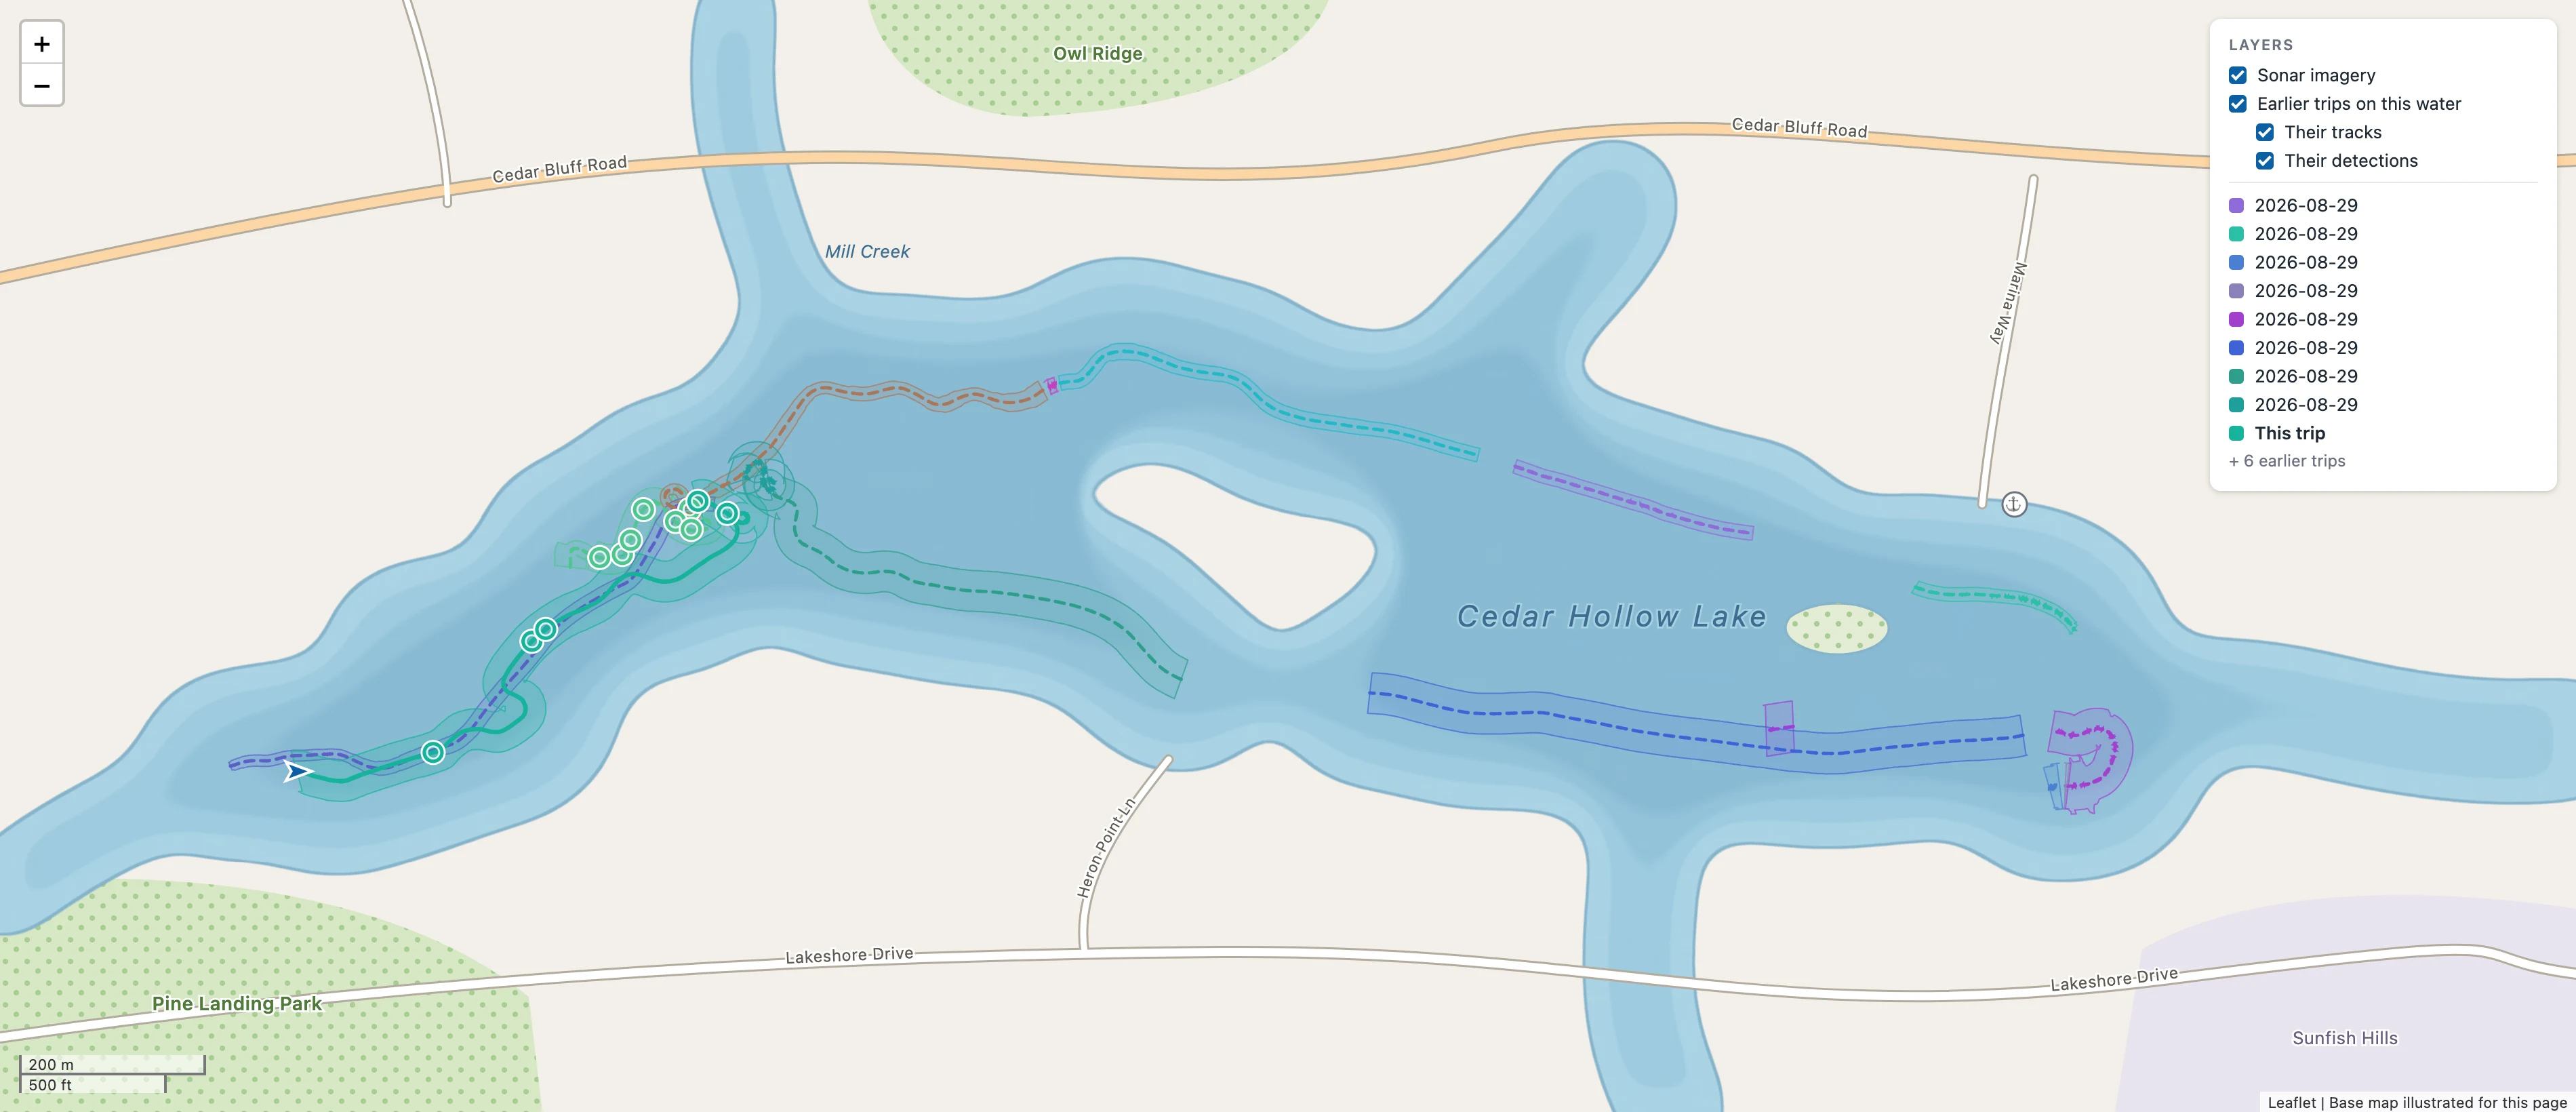
Every detection at a real latitude and longitude.
Positions come from the recording's own per-ping GPS track and the geometry of the beam that saw each return, not an estimate from the file name. Click a detection on the map and the sonar return it came from opens beside it.
Every trip you have made on that water is drawn too, each in its own colour, so the map shows where you have looked as well as what you found.
The background map is loaded from OpenStreetMap, so it needs an internet connection. Without one, your tracks, coverage and detections still draw, on a blank background.
Several trips over one lake. The tracks are real; the lake, roads and names under them are invented here so the location stays private.
Coverage sweep
The water your sonar actually saw.
The boat track says where you went. It does not say what the sonar saw. Coverage turns each ping's swath into polygons on the map, so the gaps between passes show up. The gaps are often more useful than the finds, because they are what you still have not looked at.
My waters
Every trip, grouped by the lake it was on.
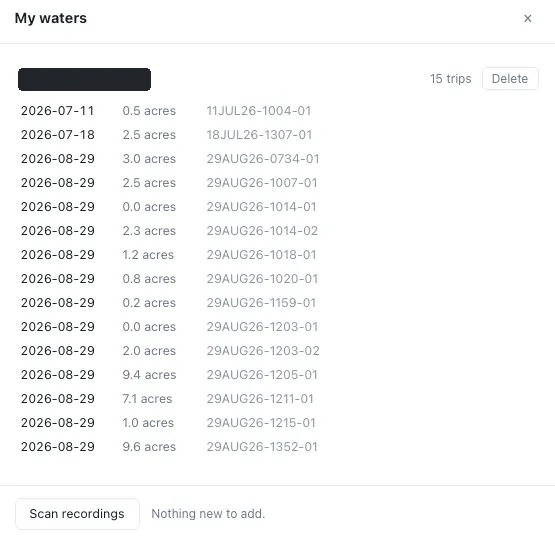
A water is named from where its first recording happened, and you can rename it. Nothing calls out to a geocoding service. Each trip carries the acreage it actually covered, so a season reads as a running total of water swept.
One water, every trip on it, and what each covered.
Compare trips
What changed since last time.
Run a trip against an earlier pass over the same water and every spot is sorted. "Not found" deliberately does not say "gone": the software can't tell a pile that silted in from a pass that never covered it closely enough, so it says only what it knows.
Spot
Result
Depth change
Spot 3
New this trip
–
Spot 1
Deeper
+0.6 ft
Spot 4
Shallower
−0.4 ft
Spot 5
Unchanged
0.0 ft
Spot 2
Not found this trip
–
Example layout. The five results are the ones the app reports.
Spots
One place to drive to, not a dozen marks.
A pass over one brush pile leaves marks spread over ten or twenty metres. Spots group nearby detections into the single place you would navigate to, so the pile reaches the map and your waypoint file as one icon.
Palette and display settings
Six palettes, switched live.
Amber, Gray, Blue, Copper, Chirp and Jet switch instantly with no re-render. Around them sit Tone, Levels & colour, Detail and Overlays: brightness, contrast, gamma, dark and light point, saturation, smoothing, sharpen, TVG, noise and ghost reject, water column and range. Each group says what is changed in it, and Reset all lights up whenever anything is. The imagery underneath never changes. Only the way it's drawn does. Try four of them on the recording below.
Palette
Measure and Sonar Forensics
Judge a return on more than a hunch.
Measure length, height and depth directly off the imagery, using the recording's own per-ping geometry rather than an assumed scale.
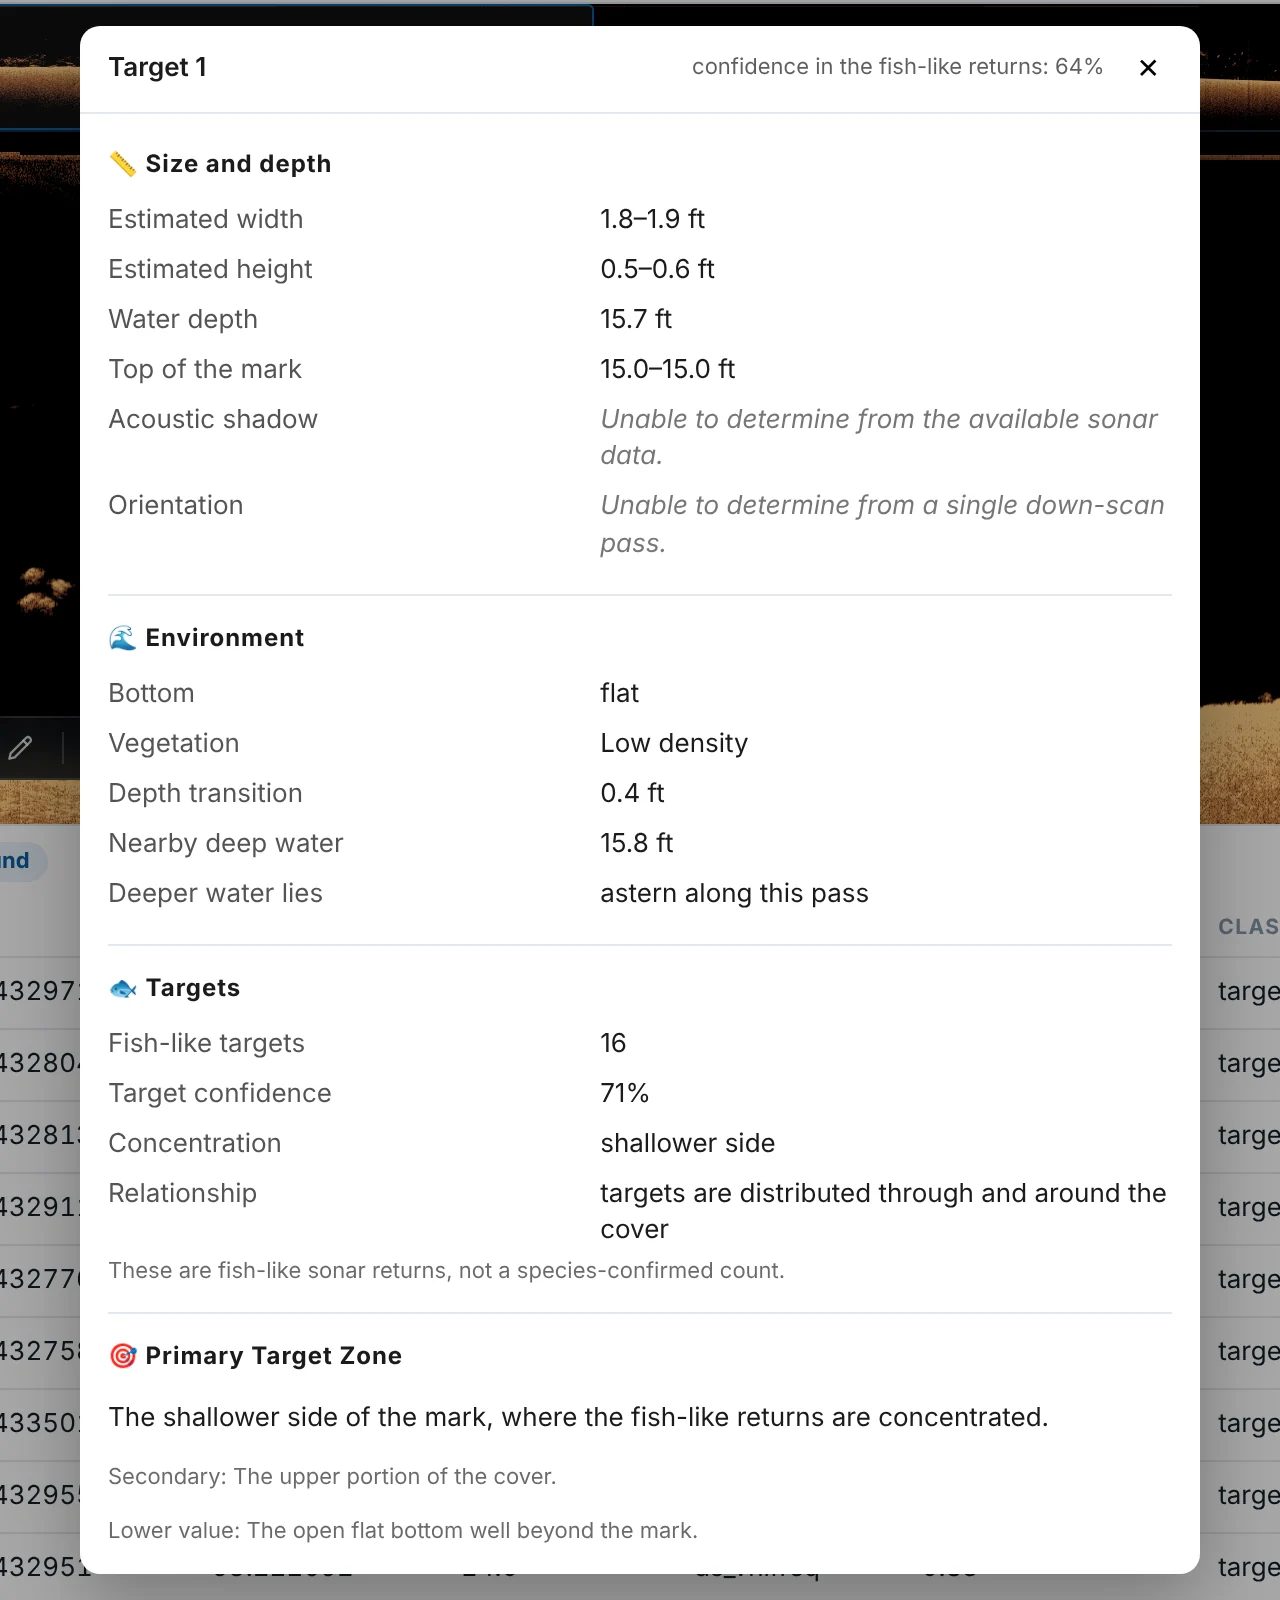
Sonar Forensics adds a full report on a detection: a classification, a description of the structure and its surroundings, a score with its reasoning, and a plain statement of what it can and can't tell from one pass.
The report for one detection on this recording.
Pins and review
Your own marks and verdicts, kept apart.
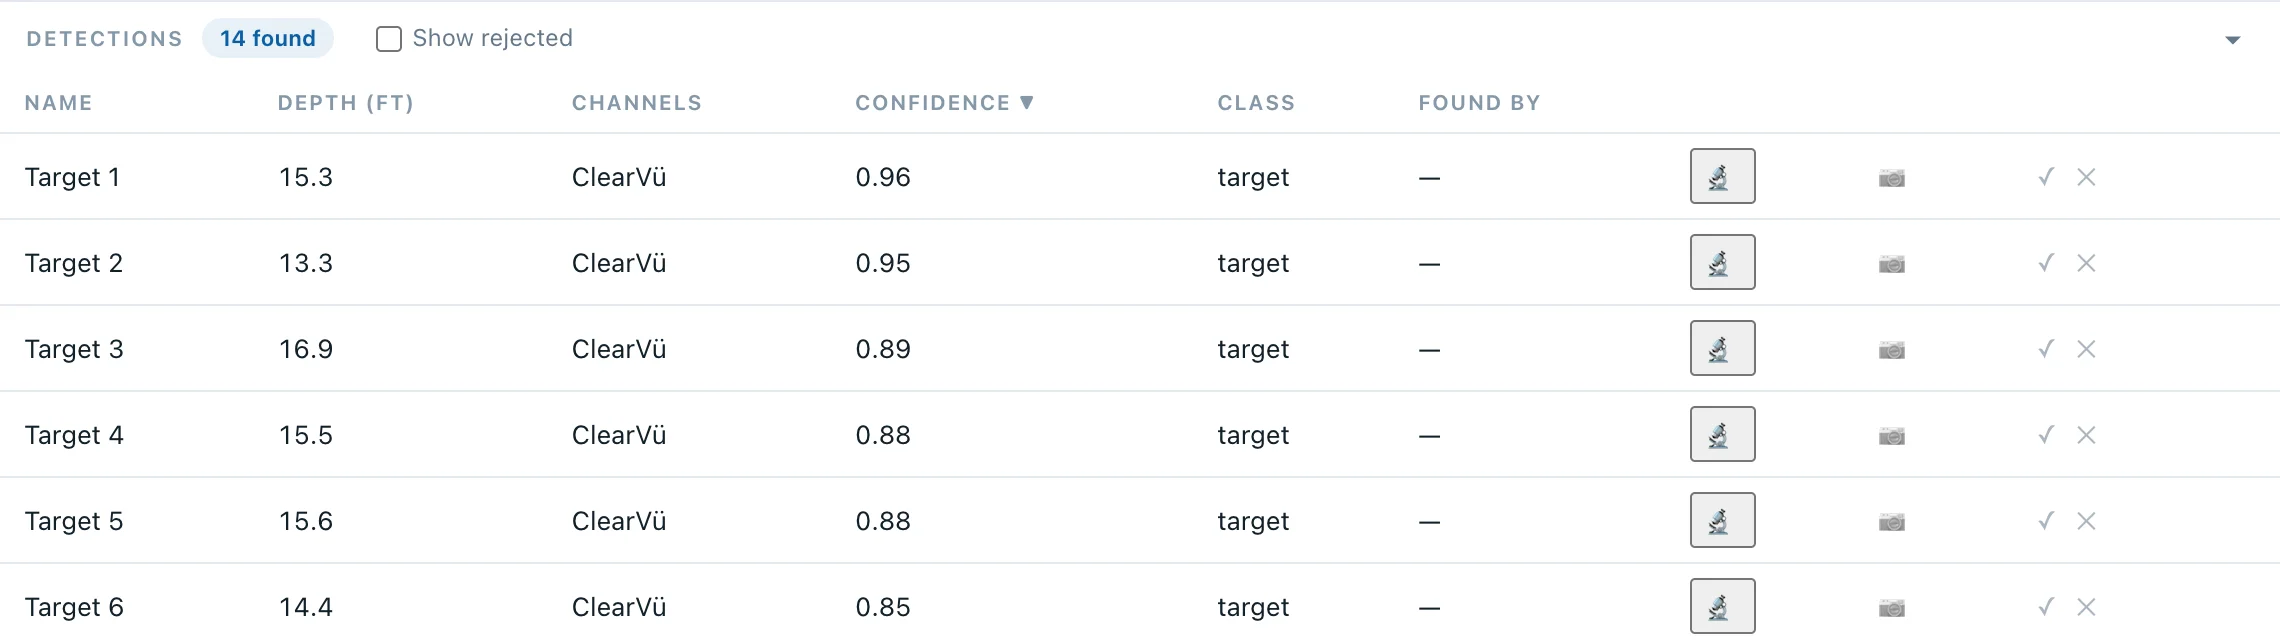
Drop a pin anywhere to mark a spot yourself, and record a verdict on any detection: accepted or rejected. Both live in their own file next to the recording, never inside the detector's output, so running Analyze again can't overwrite them. Add a note to any mark, and it rides out with the waypoint in your GPX. The Found by column shows whether a mark came from the detector, the AI, or both.
The detections list for this recording. The position columns are left out of this picture.
Playback
Watch it back the way it was logged.
Play, pause, and run a recording at 1×, 2×, 4× or 8× when the interesting water is half an hour in. Down scan plays with its depth profile underneath; side scan plays as a waterfall beside the map, with the boat moving along its track.
Speedping 0
Feet or metres
Converted where the number is drawn.
Depth in feet or metres, temperature in °F or °C, speed in mph, knots or km/h. Conversion happens where the number is drawn, so what the app measured stays exactly what it measured.
Depth
15.3 ft
Water temperature
84.9 °F
Boat speed
1.5 mph
Spot cards
One find, as a picture you can send.
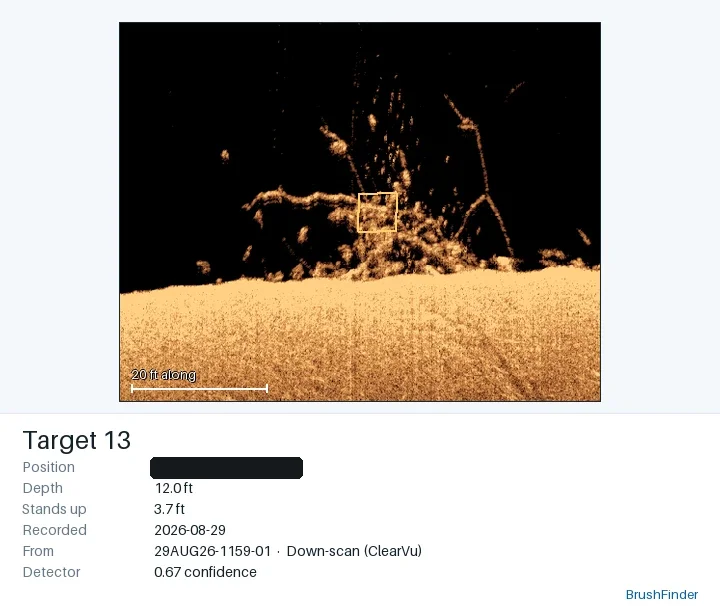
A find lives in a results row, a pin on the map and a 200 MB recording nobody is going to text. A spot card puts the evidence and the details in one image: the sonar around the mark, cropped and enlarged, over its position, depth, height off the bottom, date and confidence.
For anything else, the camera button on the tool bar saves exactly what is on screen as an image, your drawing included.
The position is on the card, so a card is a spot given away. BrushFinder only writes the file. Where it goes is up to you.
A spot card from this recording. The position shown is not the real one.
GPX export
Waypoints your chartplotter can load.
Export a GPX 1.1 file your chartplotter reads directly. Nearby detections collapse into one waypoint per spot, and every waypoint is depth-labelled and carries a plain "not for navigation" note. Marks the AI found are labelled AI in the file. Want a picture instead of a coordinate? That's what spot cards are for.